Contents
Abstract 1. How the graph is built 1.1 A worked example: from news item to RDF 1.2 From question to answer 1.3 One RDF, multiple subgraphs 2. A portfolio view: correlations single-protocol dashboards cannot surface 3. Case study: the Stream–Elixir loop, October 2025 ConclusionAbstract
Existing stacks cover two ends of the risk problem: dashboards surface metrics per protocol, and simulation platforms price known risks on known protocols. Between them lies the space where most DeFi failures actually live: shared hidden exposures, recursive collateral loops, governance-linked contagion, non-obvious paths spanning on-chain state, cap tables, and off-chain entities. Relatum is a relational substrate for that space.
This note walks through how the graph is built, what a single fact looks like inside it, how one set of facts can be projected into several graphs for different questions, and why that matters across yield-bearing assets, where the risks that matter most live in the relationships between venues rather than inside any one of them.
For the argument behind this design — knowledge as compression, surprise as signal, and why graphs make second-order risk cheap to query — see the companion note How knowledge graphs surface alpha in Web3.
1. How the graph is built
Extraction agents parse heterogeneous sources (on-chain events, protocol docs, filings, governance forums, cap tables) into triples against a shared ontology that defines the entity types and the predicates that can legitimately connect them. Relationships that carry their own state, such as an employment or an attestation, are modelled as first-class resources (each with its own predicates) so they can hold a time range, provenance, and further connections. That design carries through when the RDF is projected into an LPG. The relationship stays a node the agent can traverse from, rather than being collapsed into an edge with properties hidden inside a label.
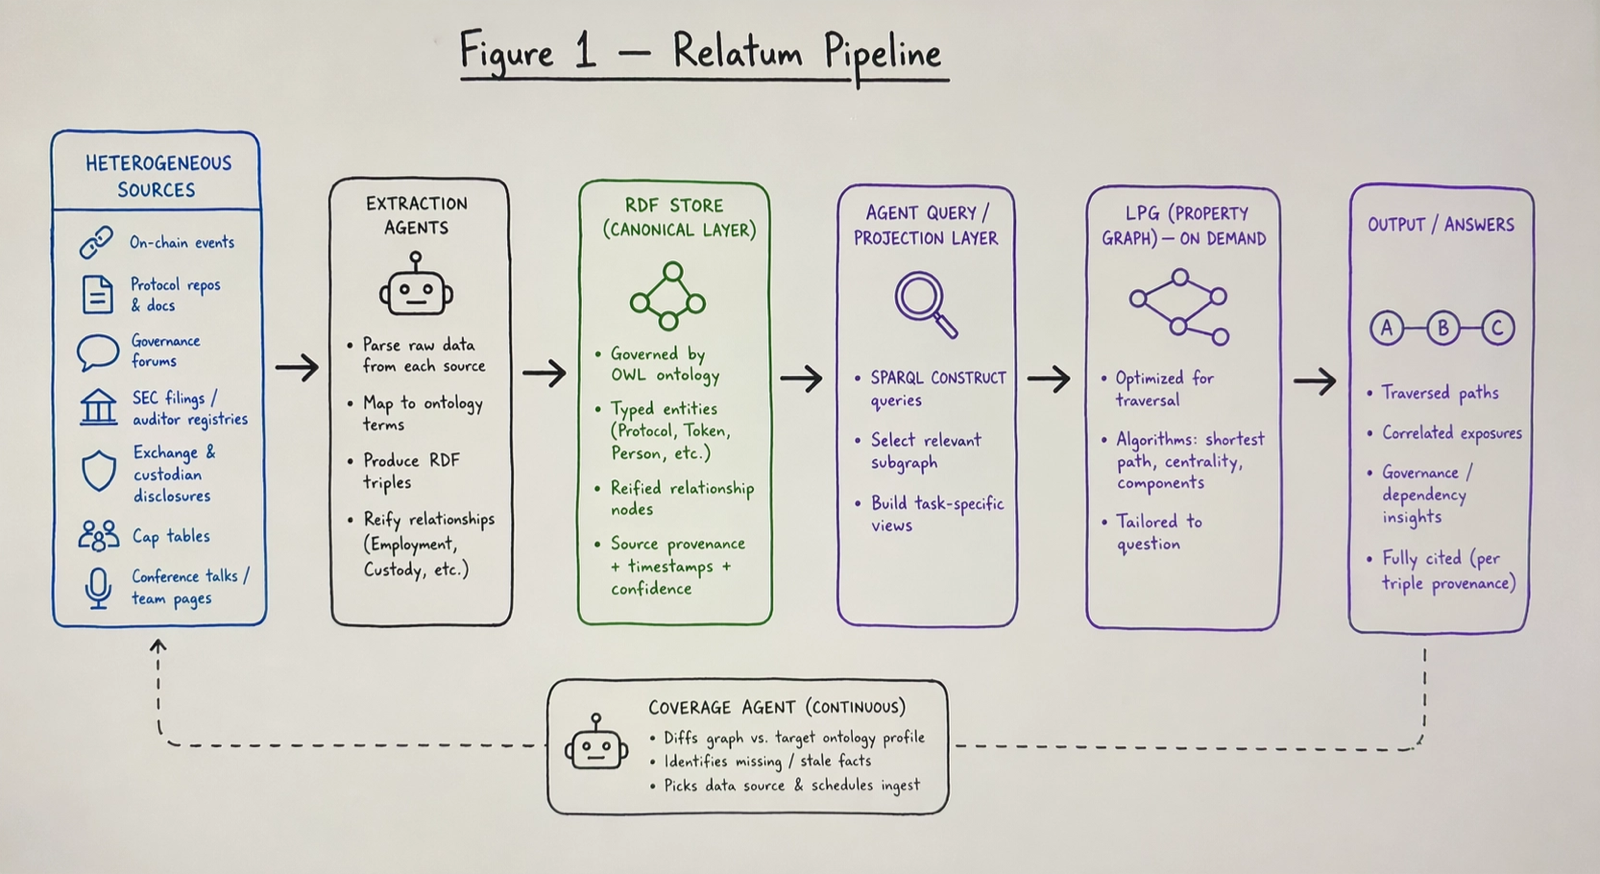
The RDF store is the canonical representation. LPGs are derived on demand by agents that emit SPARQL queries projecting the subset of nodes and edges relevant to a given question. This gives us the expressiveness and auditability of RDF alongside the traversal speed of a property graph, without maintaining two sources of truth. Construction is itself agentic: a coverage agent continuously diffs the current graph against a target ontology profile, identifies missing entities or stale facts, picks a data source, and schedules an ingest.
The ontology is a multi-week upfront investment, and the payoff compounds as new sources land against existing nodes. The dominant operational cost is data acquisition (parsing filings, reconciling forum handles to multisig signers, tracing cap tables), not storing triples. Ontology design is done conceptually first, ahead of any single use case, so successive extractors extend a shared model rather than growing parallel ones that quietly diverge.
1.1 A worked example: from news item to RDF
Suppose the following item arrives:
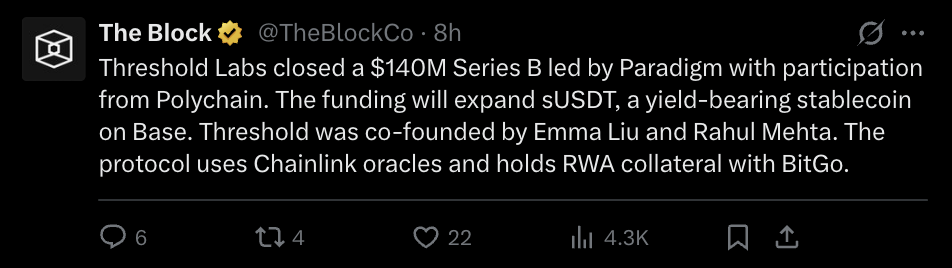
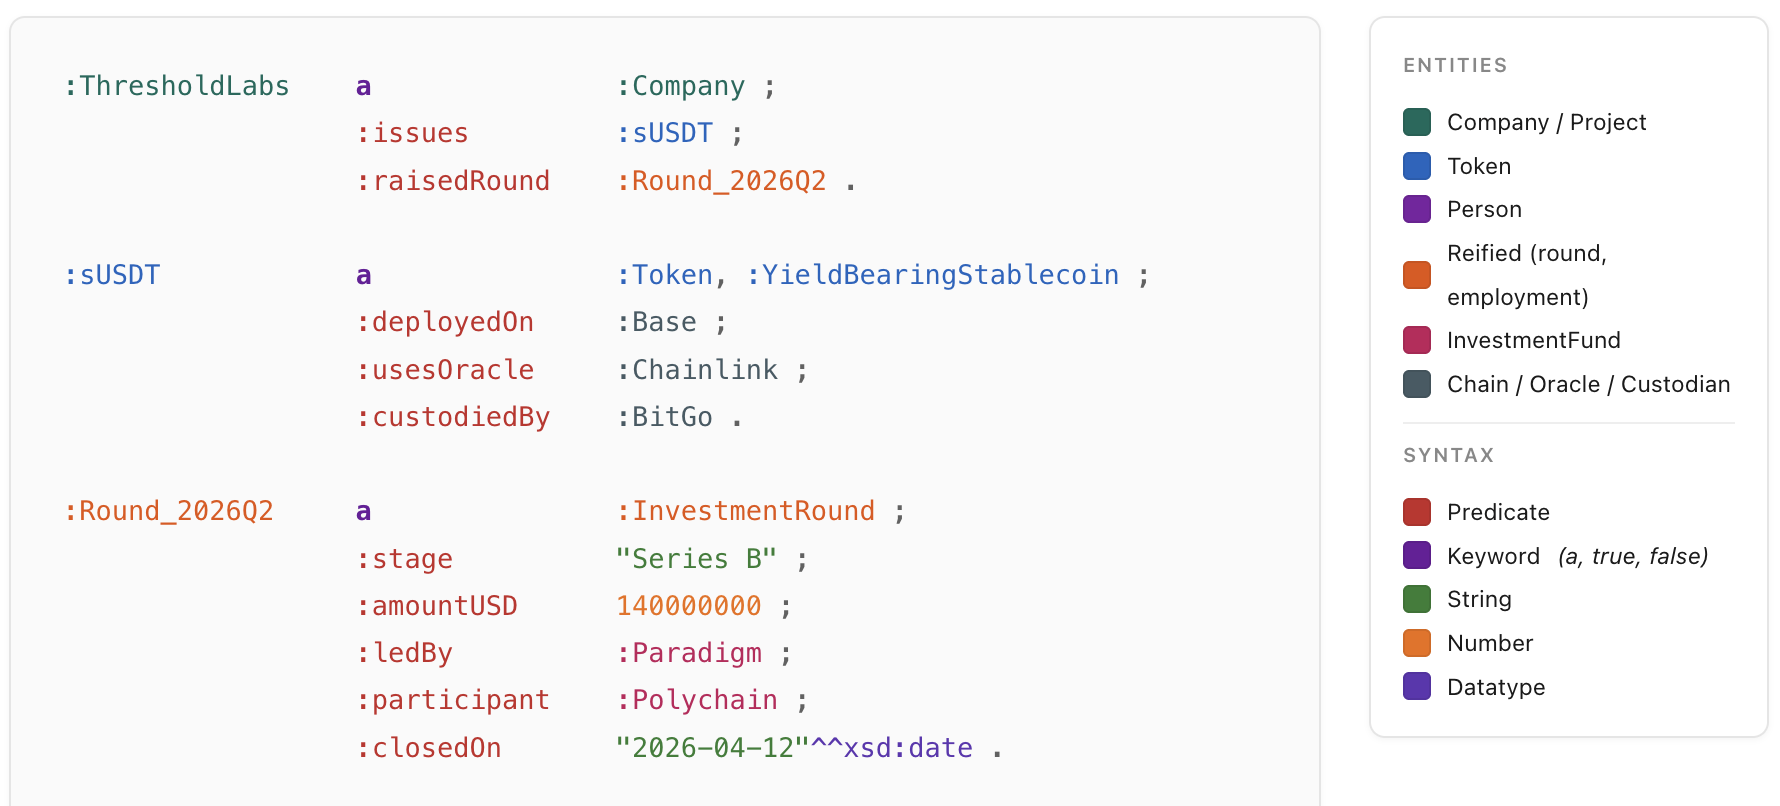
An extraction agent produces the following triples against the ontology, shown in Turtle (abbreviated):
The triples above rendered as a small graph:
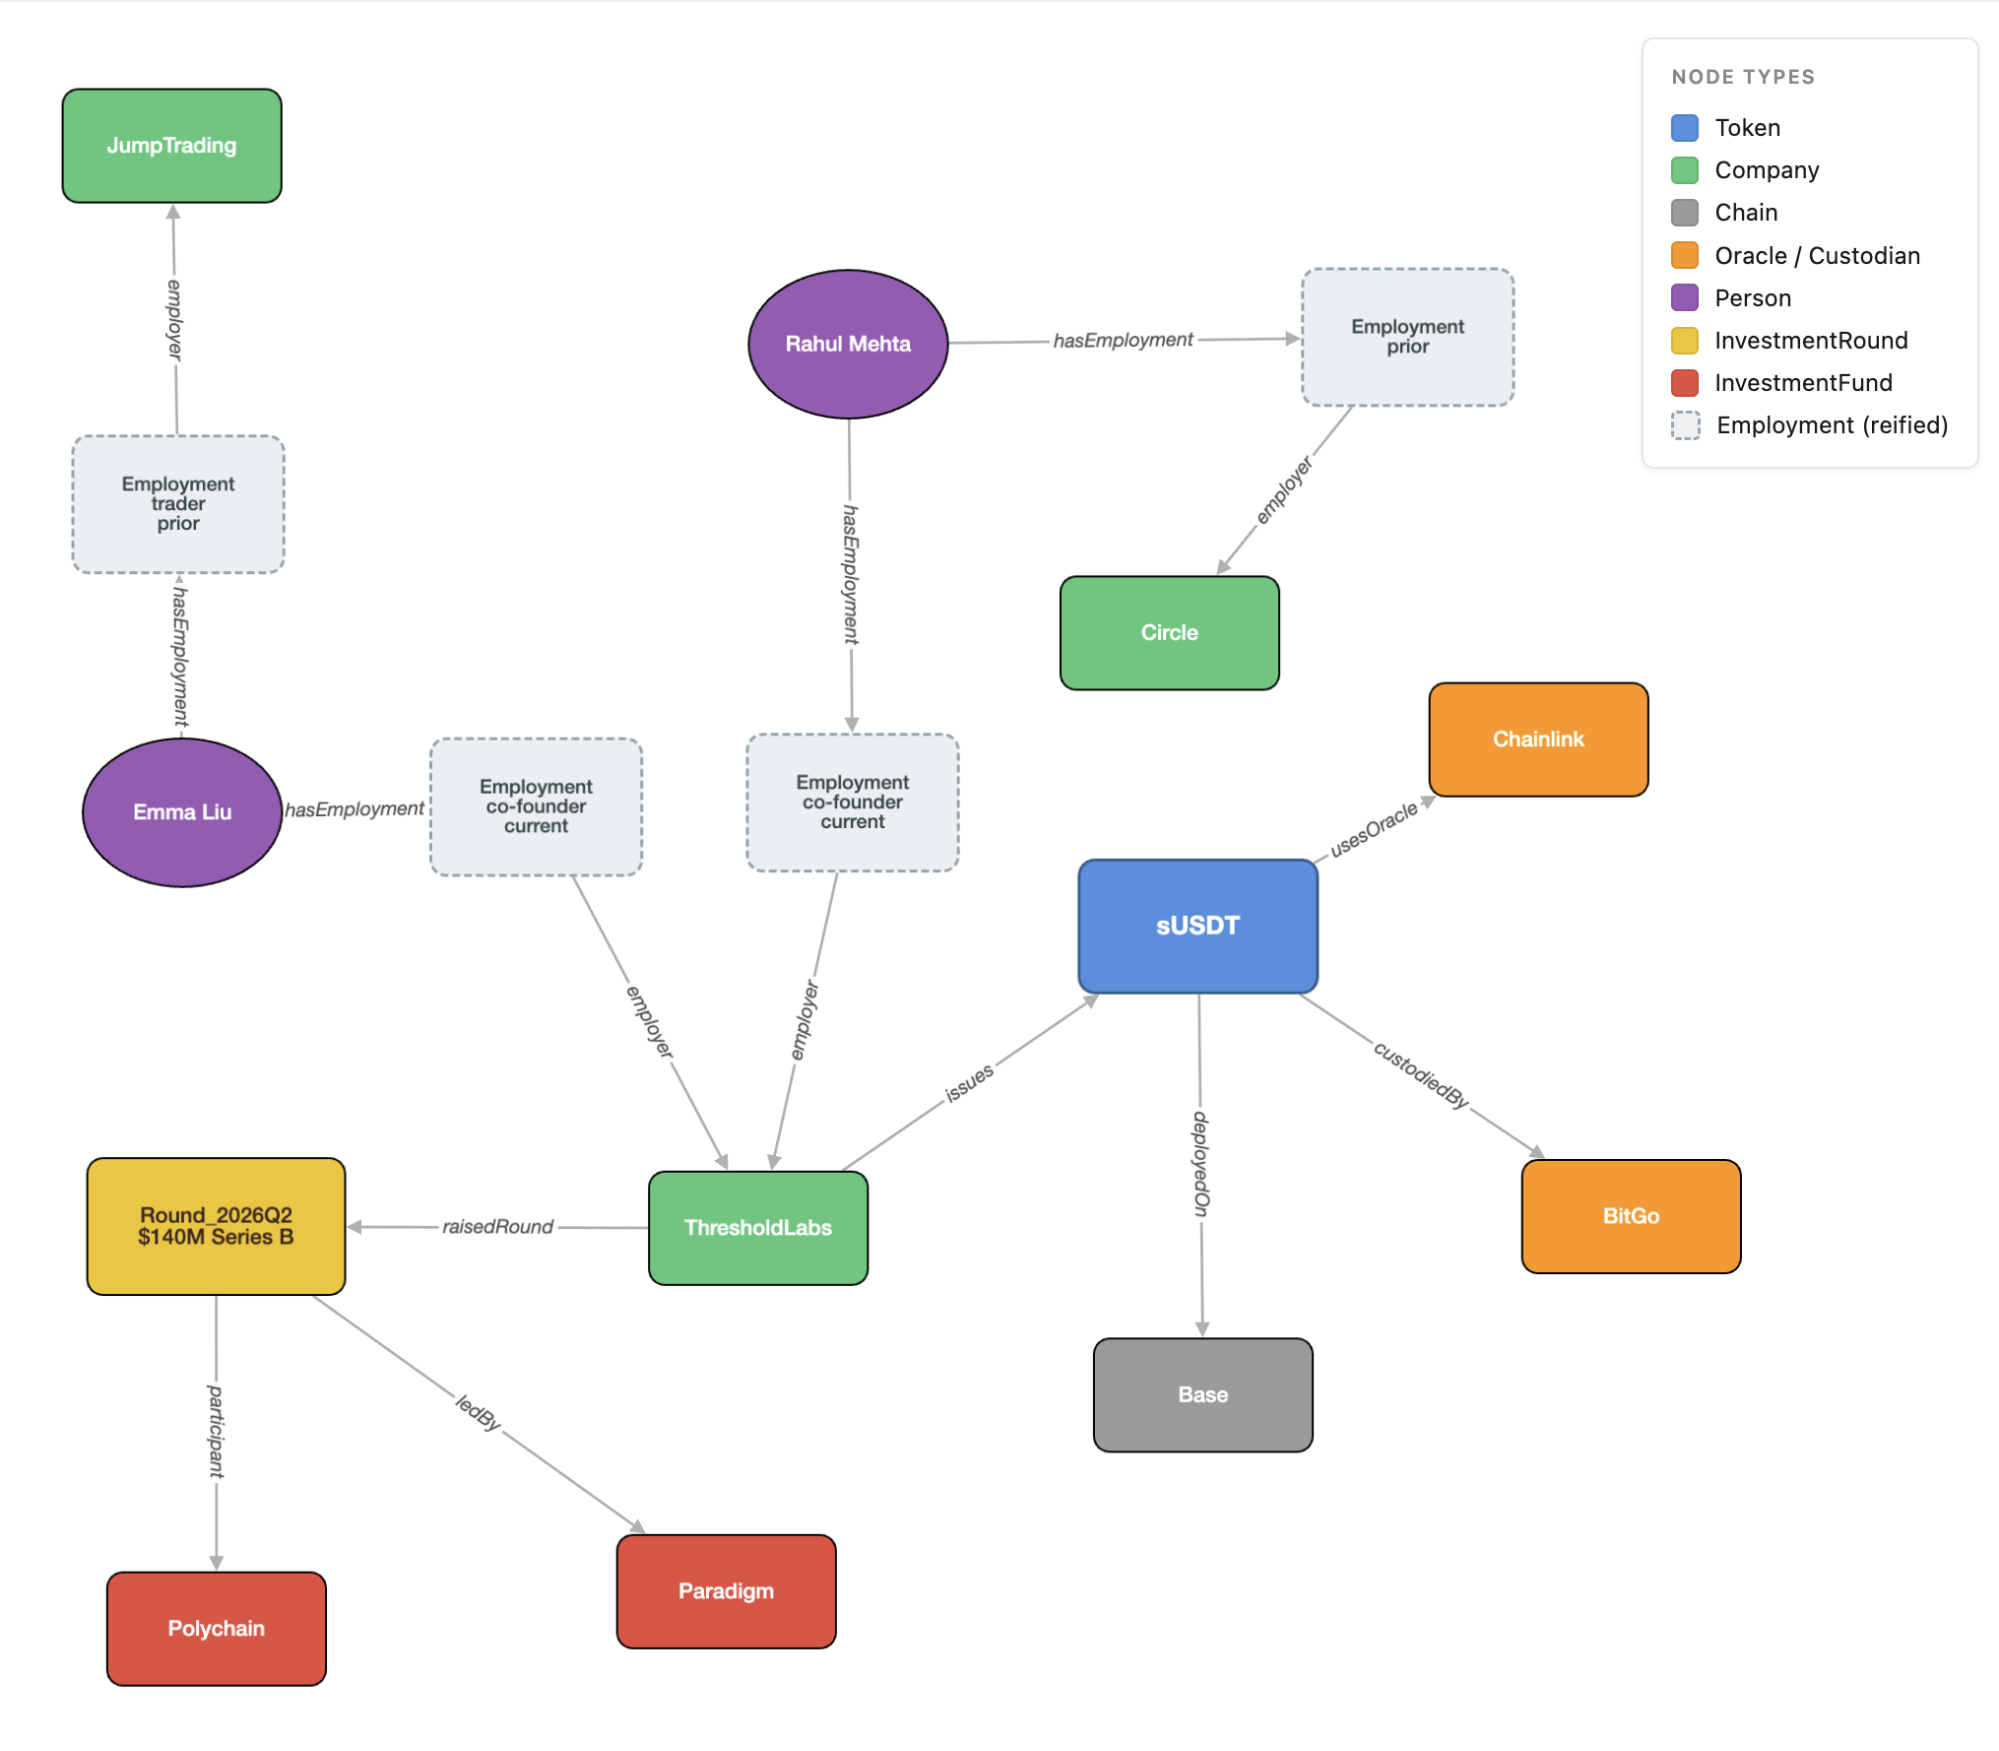
Three things are worth noticing. The employments are nodes, not edge properties, so each one carries its own time range and role independently and can later connect to a team, a vesting schedule, or a departure event. The investment round is a node, not a direct edge from Paradigm to ThresholdLabs, so participants, valuation, terms, and later follow-on rounds can all attach to it. And every entity has a stable identifier, so the next article about Paradigm, BitGo, or Emma Liu attaches to the same nodes rather than creating duplicates, which is what gives the graph its connective power over time.
1.2 From question to answer
The agent's job is to get from a natural-language question to a cited path. It picks a projection, composes the SPARQL, runs it against the store, and returns an answer whose every step is traceable.
Asked which of our watched yield-bearing stablecoins share a custodian?, the agent reads it as an operational-dependency question and emits something like:
SELECT ?coinA ?coinB ?custodian WHERE {

    ?coinA a :YieldBearingStablecoin ; :custodiedBy ?custodian .

    ?coinB a :YieldBearingStablecoin ; :custodiedBy ?custodian .

  FILTER(str(?coinA) < str(?coinB))
}
The answer comes back as cited triples. For example, sUSDT and USDc share BitGo as custodian, with source URLs and the timestamp each triple was first seen. Because provenance and time range travel with every fact, the same question re-asked six months later can also return overlap exists, but only since 2026-02. The temporal claim is checked against the graph, not reconstructed by hand. The agent is not reading from a cached dashboard. It is traversing live, cited facts, and the output can be audited back to everyone.
1.3 One RDF, multiple subgraphs
The same triples can be projected into several LPGs, each tuned for a different question. The agent picks the projection based on the question, runs graph algorithms over it (shortest path, common neighbours, connected components, centrality), and returns paths with source citations attached to every triple.
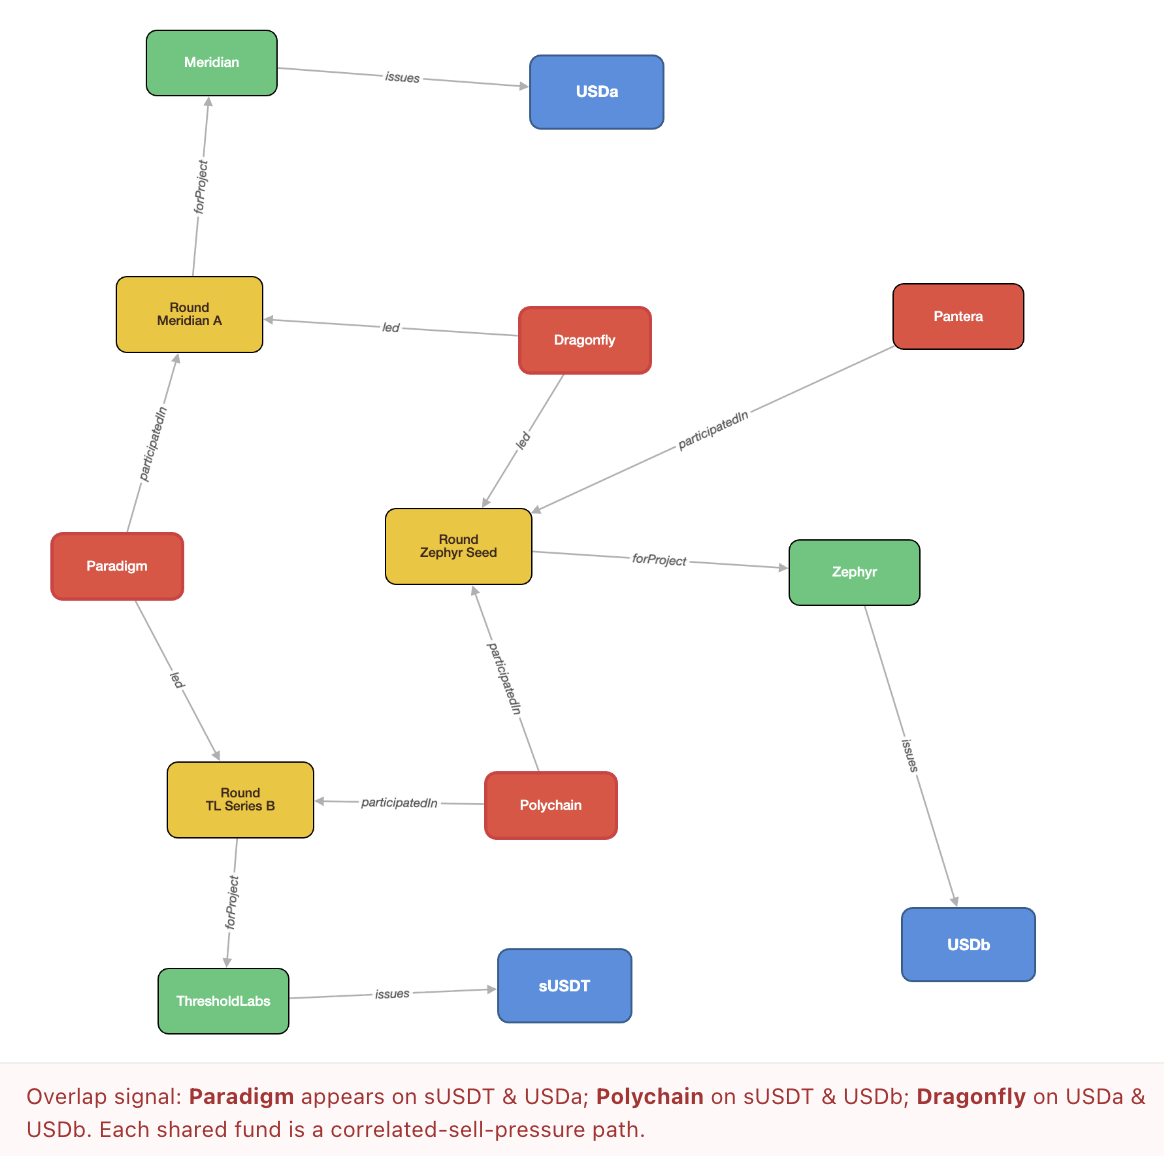
Investor-exposure projection.
Which funds are exposed to this stablecoin, and what other yield-bearing stablecoins or lending protocols do they also back?
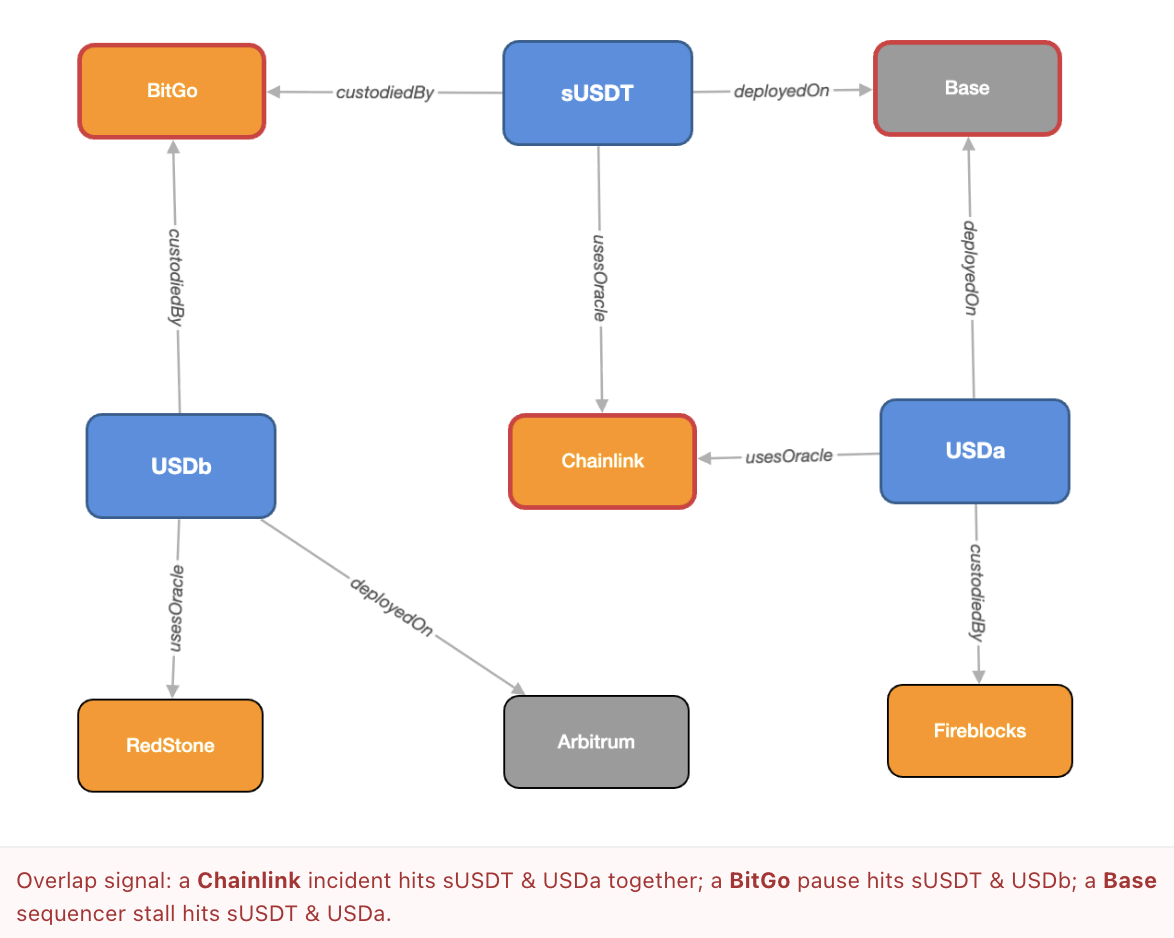
Operational-dependency projection.
If an oracle has a price-feed incident, a custodian pauses withdrawals, or a chain's sequencer stalls — which coins are simultaneously affected, and by what path?
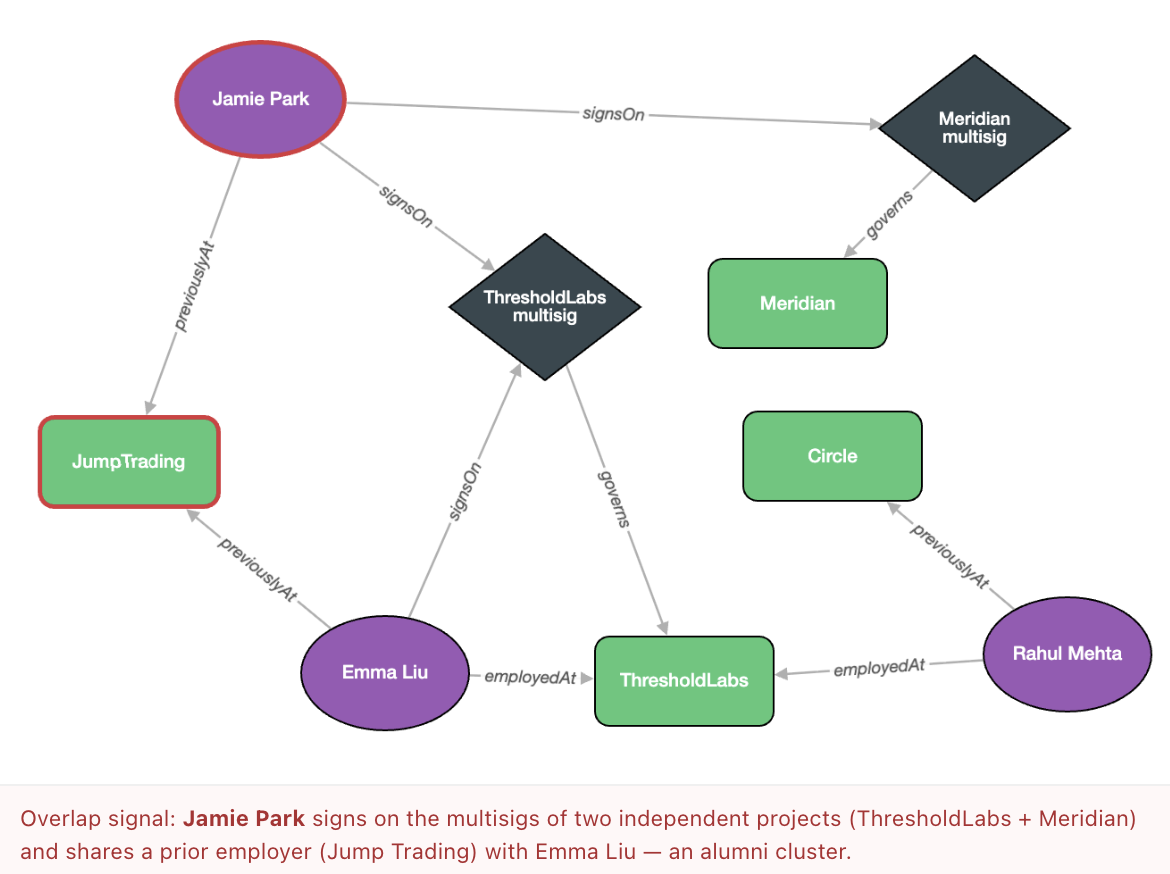
Personnel and governance projection.
Who has de facto control, across how many entities, and where do those controls overlap?
Each projection is one SPARQL query against the RDF store. Adding a fourth or fifth projection costs the price of a query, not a new data pipeline.
2. A portfolio view: correlations single-protocol dashboards cannot surface
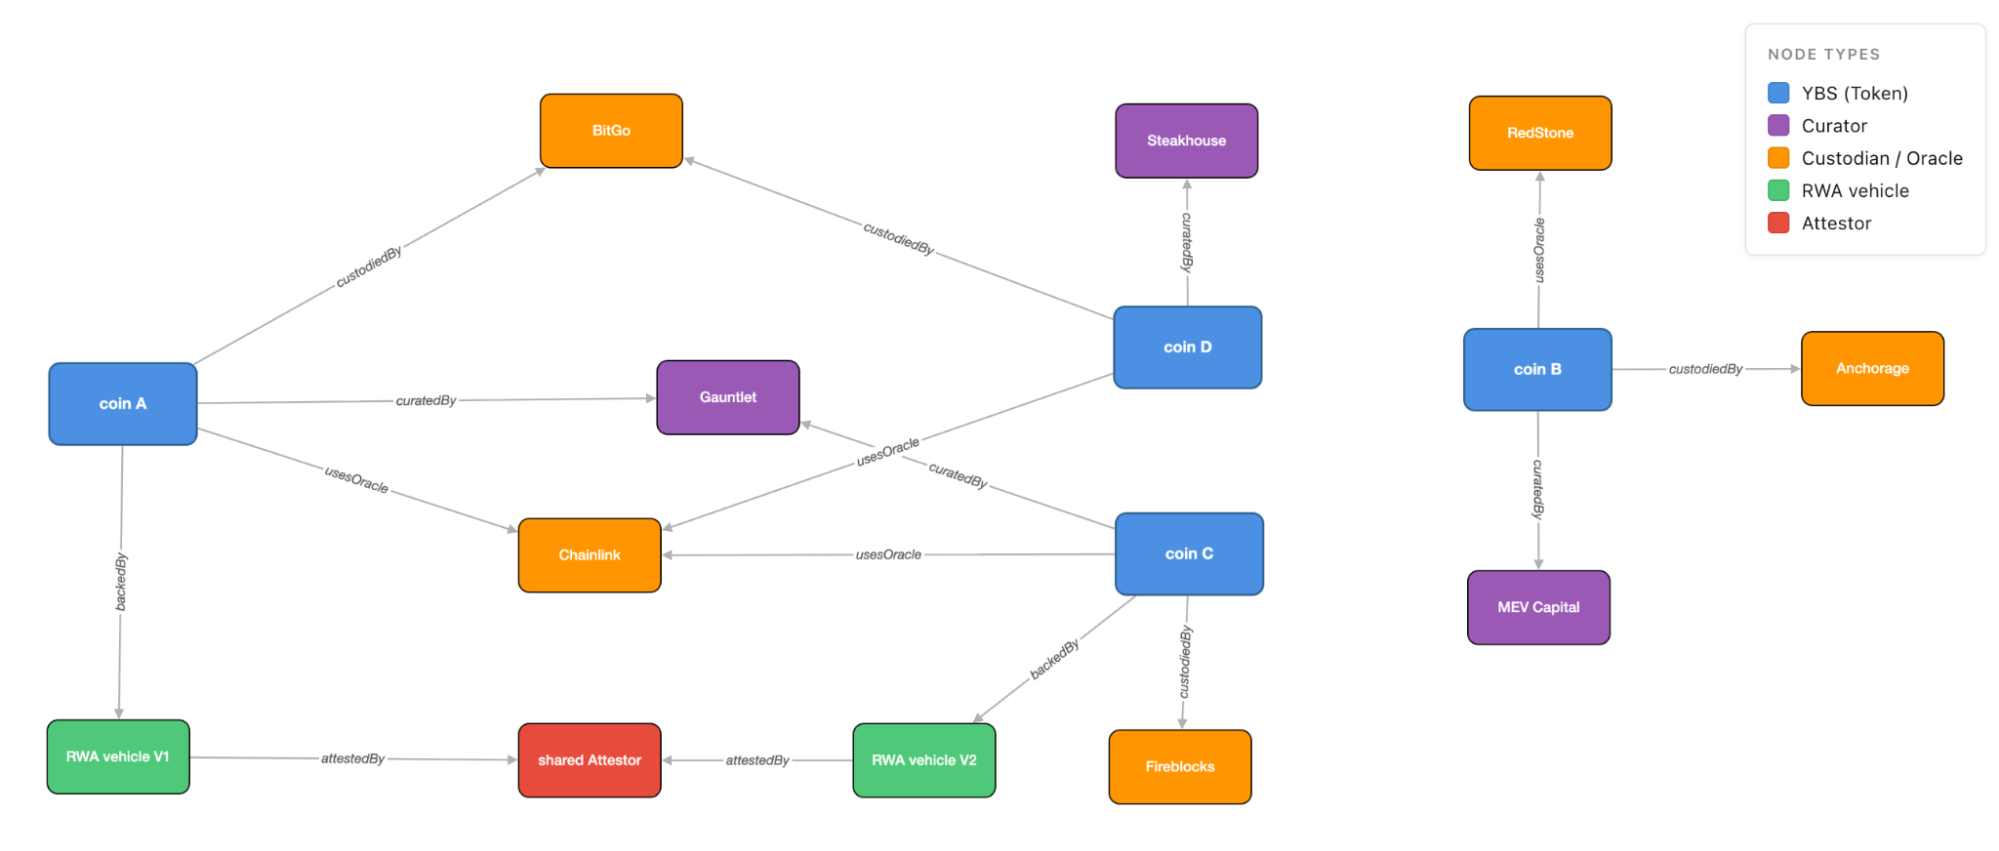
Applied to a portfolio of yield-bearing stablecoins, the three projections produce a picture no single-protocol dashboard can show. Consider a stylised row-by-row summary:
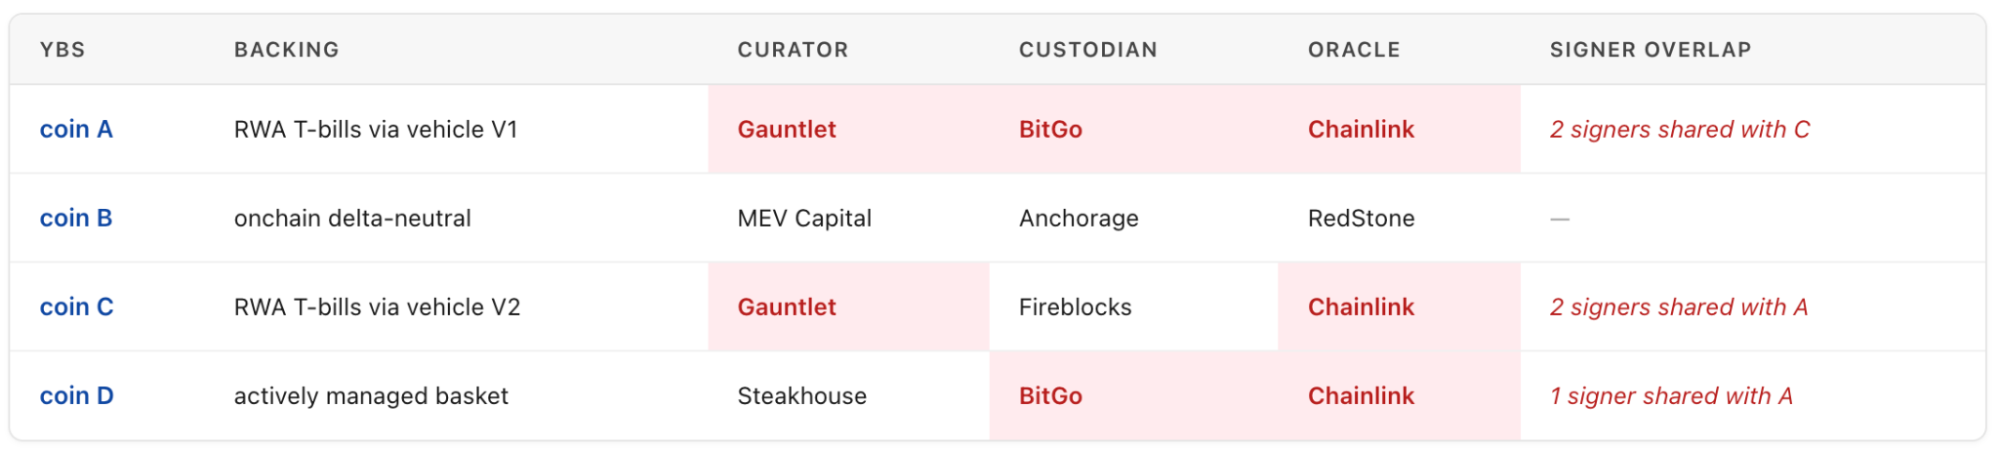
Read row by row, each coin looks distinct: different strategies, different curators in some cases, different backings. Read column by column, and the correlation structure appears. Coins A, C, and D share Chainlink as an oracle. A and D share BitGo as custodian. A and C share Gauntlet as curator and sit behind RWA vehicles that, traversed two hops further in the attestor projection, resolve to the same auditing firm.
A and C share two signers on their respective operational multisigs. A single event at any shared dependency (a custodian pause, an oracle deprecation, a key compromise) correlates across every coin that shares it. Without the graph, none of these exposures sits in the same table as any other. Each is a separate row in a separate spreadsheet maintained by a separate analyst.
3. Case study: the Stream–Elixir loop, October 2025
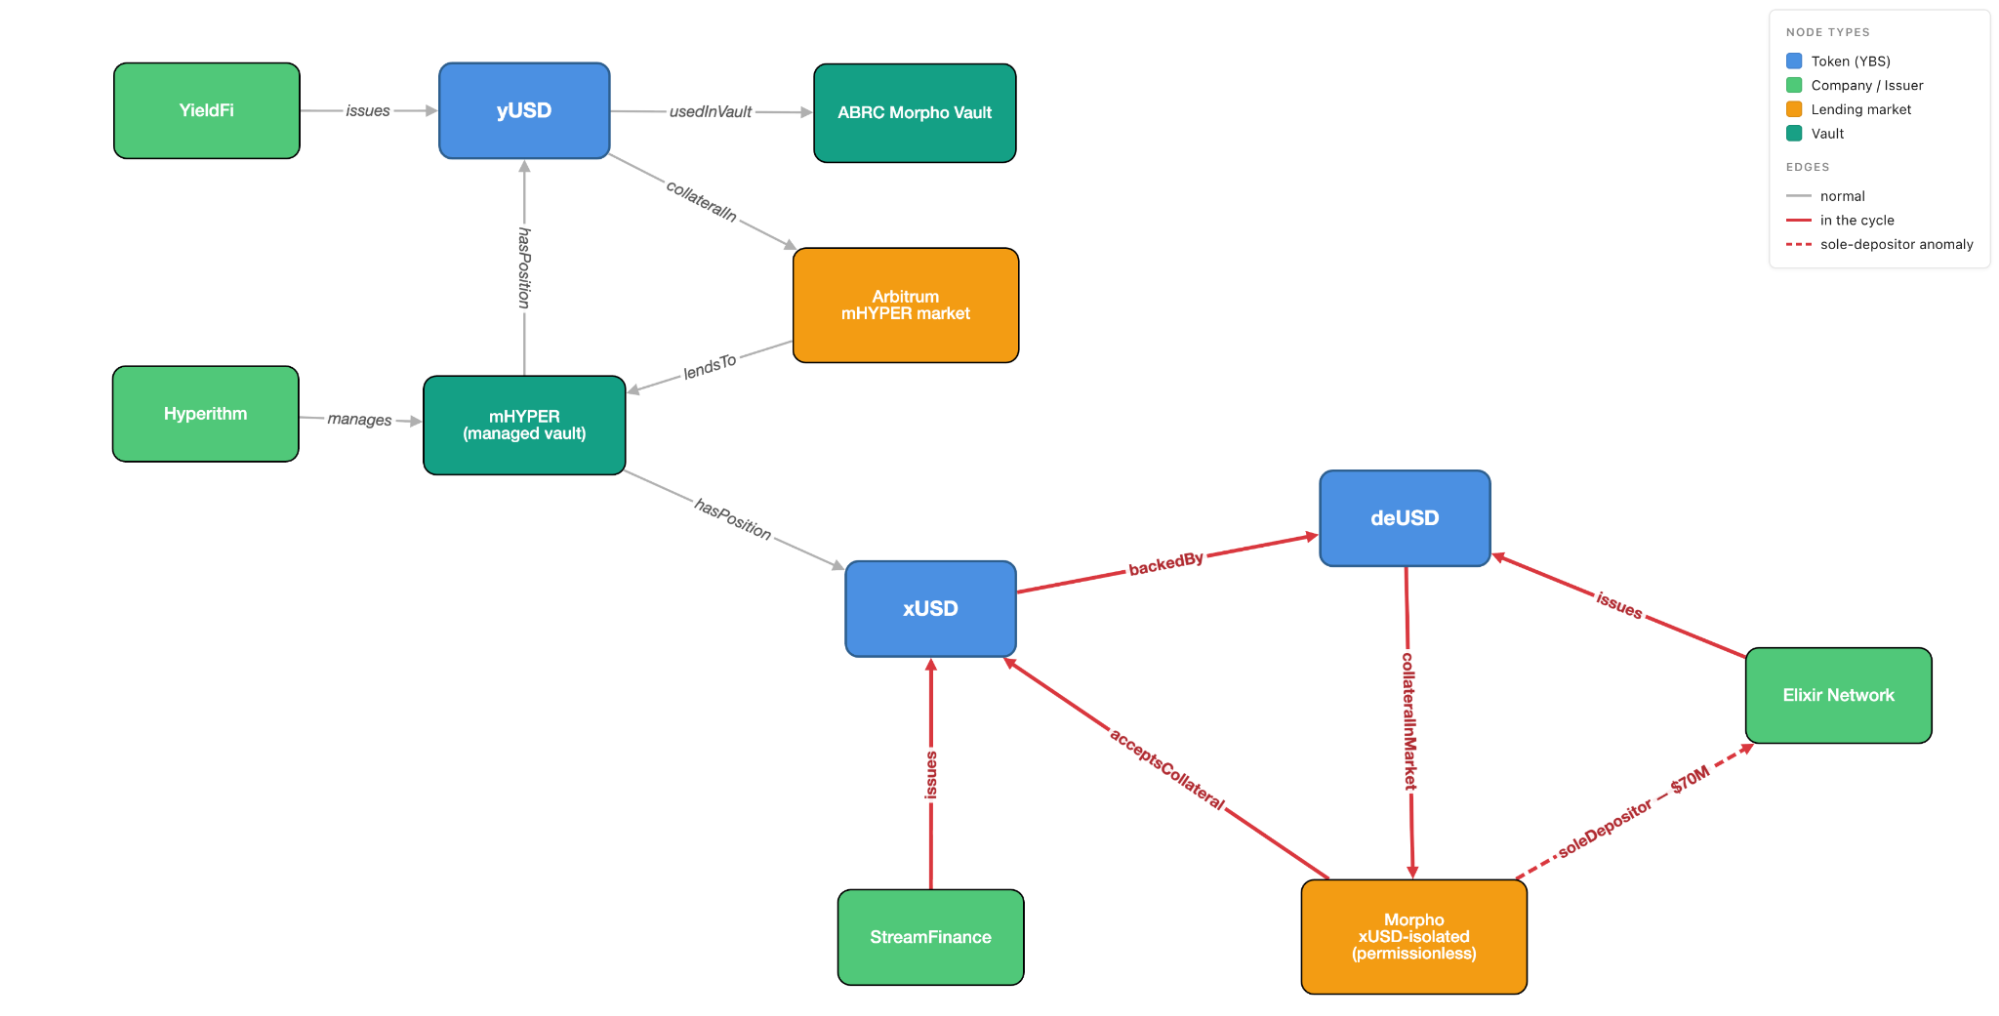
In October 2025, Stream Finance's xUSD collapsed after a recursive collateral arrangement with Elixir's deUSD unwound. xUSD was backed by deUSD, while a permissionless Morpho market whose sole depositor was Elixir itself was, in effect, minting collateral for its own backing. Hyperithm publicly stated that it pulled $10M before the failure became visible on Twitter.
Three things a graph would have flagged continuously, before any transaction hash went viral.
A cycle in the backedBy relation. One SPARQL pass returns the closed loop: xUSD → backedBy → deUSD → collateralInMarket → soleDepositor → issuedBy → xUSD.
An anomaly in the liquidity-provenance projection. A standing query (find any LendingMarket whose sole depositor is the issuer of its accepted collateral's backing token) matches the Morpho xUSD-isolated market the moment the first edge is added. Permissionless pools are indexed the same as any other, whether or not they appear on the venue's default UI.
Multi-hop downstream exposure. Ask the graph what is my transitive exposure if xUSD fails? and it returns every vault, curated position, and retail wrapper reachable in the collateral graph. Hyperithm ran this traversal by hand before pulling $10M out.
Ancillary signals already visible in other projections at the time would have sharpened the reading further:
- The May 2025 Chainlink oracle malfunction that triggered $500k of deUSD liquidations on Euler.
- The August 2025 deUSD all-time low of $0.9831.
- Inverse Finance's vote to sunset deUSD markets.
- xUSD persistently trading above peg, deUSD volume routinely below $100k against a $160m market cap.
None of these in isolation is a collapse signal. Aggregated along the same collateral cone, each is a weight on the edge pointing at trouble. What the graph does not do: tell you recursive minting is fraudulent. That judgment still belongs to a human reviewer or a policy-aware agent. What it does do is make the structure visible continuously, at every edge addition, rather than on the day the transaction hashes finally go viral.
Conclusion
Risk is downstream of architecture. A parameter-simulation stack rebuilds when a protocol migrates from V1 to V2. A well-modelled ontology absorbs the same change as new subclasses and new predicates, and every query that is already running keeps running. What the infrastructure actually produces is a cited path, not a score.
What does that mean for stakeholders:
- For a risk committee or institutional underwriter: an auditable trail from claim to triple to source, updated continuously, at the resolution a decision can be defended on.
- For a Sky Agent or similar capital allocator: early visibility on correlated exposures inside the deployment envelope (the shared custodians, oracles, signers, and curators that will correlate at the next shared-dependency event) before governance asks.
- For a protocol team: a standing representation of the system's own dependencies that survives architectural migrations, rather than a model that has to be rebuilt each time the underlying contracts change.
The deliverable in every case is the path. A risk committee, an allocation-approval process, or an institutional underwriter acts on it, not on a number abstracted away from the sources.